How many times have you pondered over which images to use in a paragraph, blog post, web page, etc.?
I struggle choosing a visual for my content. Yet, it’s important, as frequently cited research shows that images attract more people to the content and help people retain the content they consume longer.
Knowing images are crucial to the success of the post, I focus on the matter even more. Thankfully, in my career I had to learn how to use Adobe Photoshop, Adobe Illustrator, or even Corel Draw. A long time ago, I was a designer for a small advertising agency. Those days helped me understand the difference between good and bad design, which has been helpful in creating a blog.
Today I present 12 types of visuals you can use in a blog post. You do not have to use all of them. See what inspires you given your content marketing strategy, audience, and formats.
1. Data-driven visuals
To be a well-known leader in your industry, start creating data-driven content. Designed as charts or graphs, it can make it easier for your audience to comprehend your message than with text only.
QuickSprout research reveals that articles with data-driven visuals rank fourth in shareable formats. More noteworthy, the same research shows that blog posts with graphs and charts receive more trackbacks – 258% more than blog posts with other types of images.
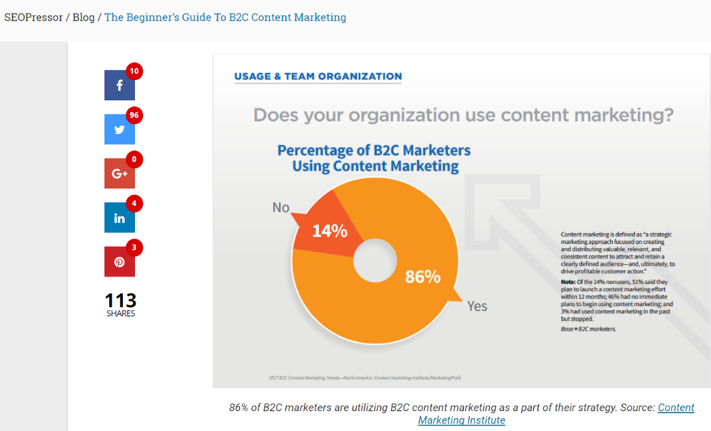
For instance, Content Marketing Institute’s annual benchmark research on the industry includes a lot of data-based visuals. Someone who needs statistics to back up an article regarding the importance of content marketing is likely to use CMI’s data-driven visuals. Take for example SEOPressor’s article for beginning B2C content marketers.
Takeaway tip: People love sharing new data and well-researched information that also looks awesome in a visual.
2. Quotes
Influencer marketing is a great strategy for extending your content marketing reach in a valuable way. Creating an image with the influencer and his or her quote, you create a memorable image.
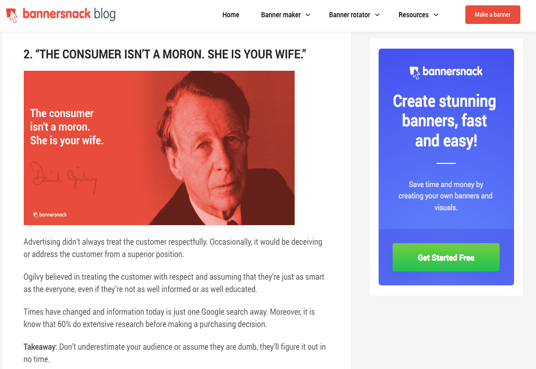
In a 2015 article on Bannersnack, we included lessons learned from David Ogilvy, the father of modern advertising, that relate to online marketing. To make it more memorable, powerful, and easier to read and share, a visual was created for each of his quotes included in the article.
You also can incorporate quote visuals from living influencers, particularly within your industry, as that can increase the chances the influencer responds to your content (and shares with his or her audiences).
Takeaway tip: Visualizing quotes in blog posts can help you make statements backed by names well known to your audience.
3. Infographics
I did not know how powerful infographics were until I researched them. I read case studies about companies that used them and got great results. I started using infographics on my blog and the company blog. The infographics continue to contribute to the site’s traffic, backlinks, and social media shares.
An infographic that is aesthetically pleasing with relevant data – that happens to be user-friendly – will undoubtedly help increase awareness of your brand. It also offers potential for several platforms beyond your blog. They can be shared on Pinterest and uploaded to SlideShare. If the infographic has multiple components, crop parts of it to create snackable visual content for Facebook, Twitter, LinkedIn, and even Instagram.
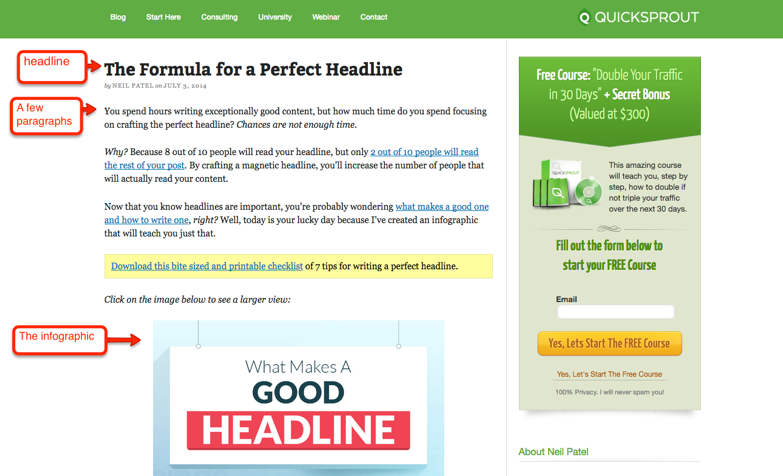
You also do not need to write extensive content for blog posts with infographics. Just write a simple paragraph presenting the information, use keywords that rank, and voilà! – your article is ready. That is how Neil Patel publishes his infographics on QuickSprout.
Takeaway tip: The crux of an infographic is not the design, but the research itself. You need to invest time and energy to get the data and create a useful wireframe to behave like a visual story.
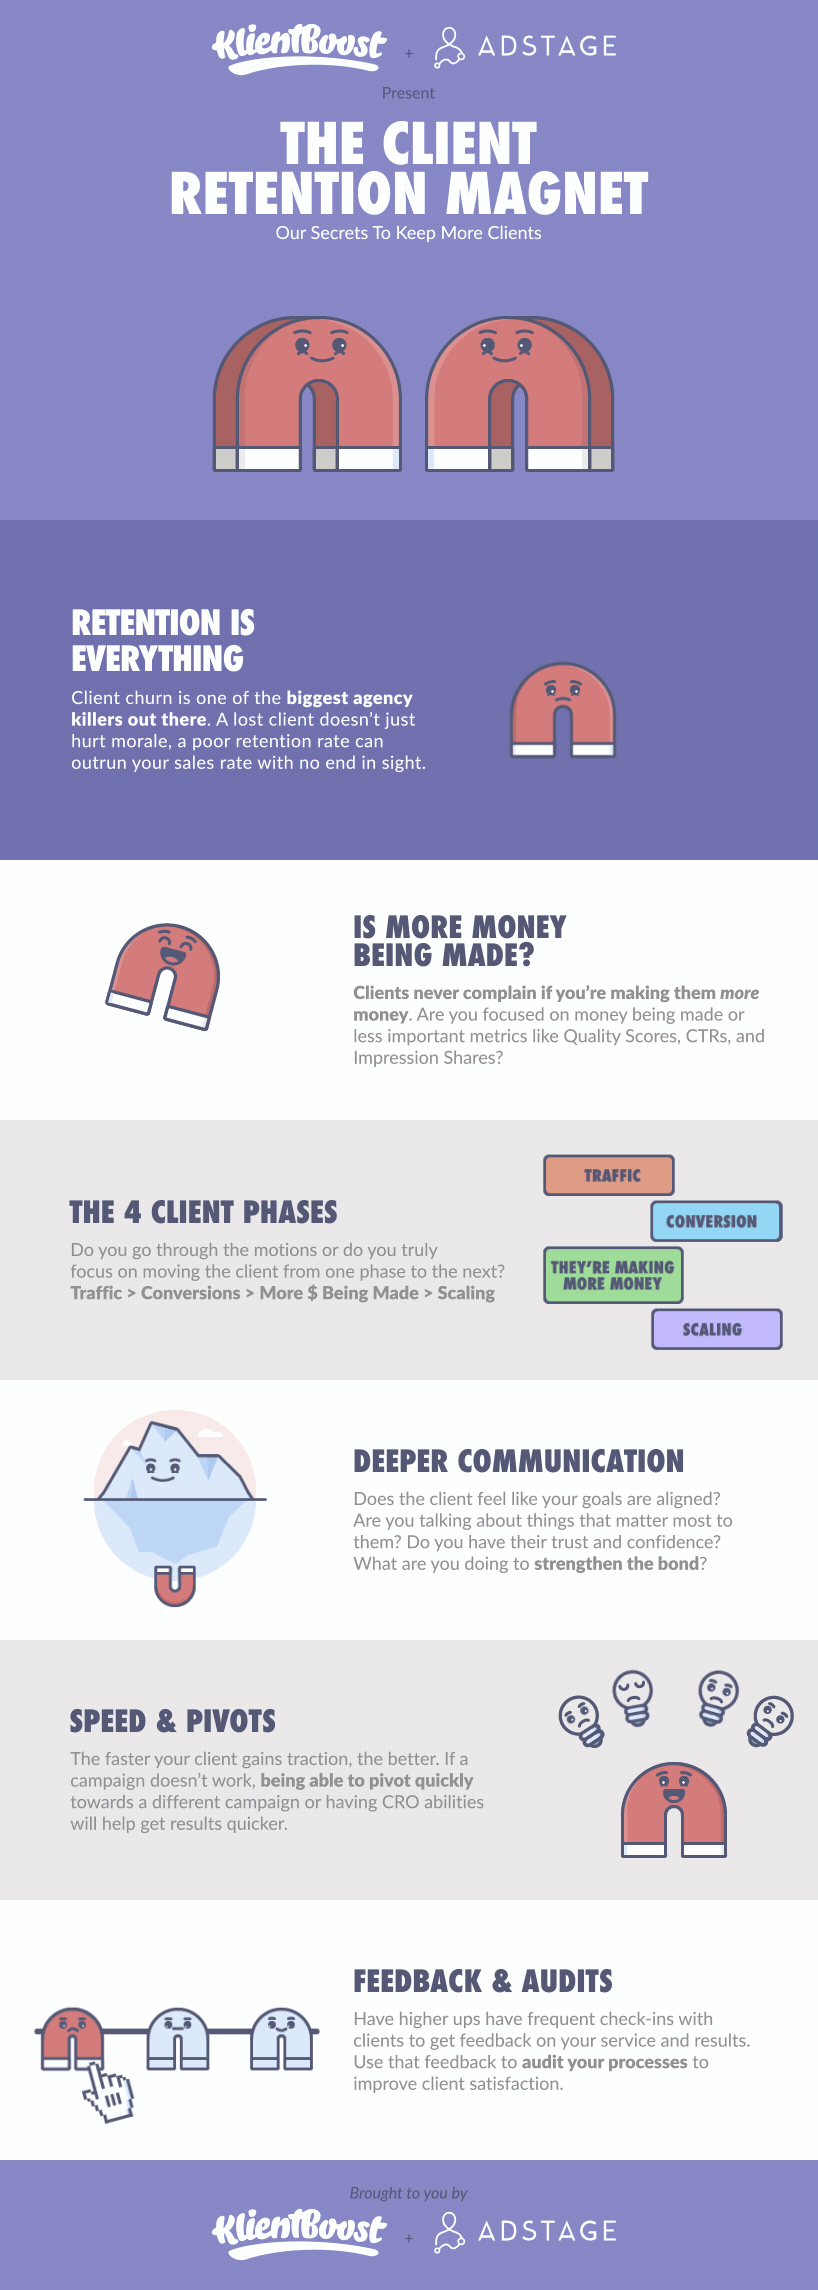
4. Gifographics
Gifographics are like infographics on steroids. Think about them as animated infographics. GIF stands for Graphics Interchange Format, originally a file type for both animated and static images that work well on the web.
You can use GIFs on Facebook, Twitter, and Instagram. On Facebook, you cannot upload them natively. You need to upload them on giphy.com then copy the new URL and paste it in a new Facebook status. Twitter allows for direct uploads, while Instagram lets you create GIFs using its Boomerang app. Buffer conducted a study that concluded that posts with featured animated graphics get more social media shares than the ones with no animated visuals. (See more about GIFs in No. 5.)
But what about gifographics? They combine the power of an infographic in a format more likely to be shared by the audience. KlientBoost uses a gifographic to show its viewers how to keep client retention high. It also published the gifographic in a more in-depth article on the blog.
…