The innovative KAI Dashboard identifies and prevents fraud and RTB technical issues across programmatic channels. Leveraging the newly unveiled dashboard insights, publishers in Kubient’s premium CTV inventory are finding opportunities to monetize an incremental of more than 20% of their inventory on average
Cloud-based software platform for digital advertising Kubient KBNT: NASDAQ launched the KAI Dashboard, a reporting and optimization platform that helps media publishers and platforms better understand and manage inventory health and to ensure the quality of the inventory that they are sending to demand platforms.
Until now, publishers and media platforms have typically lacked a clear understanding into what is causing issues for the demand side to not transact or even worse to flag their high-quality inventory as fraud. This caused a significant % of their inventory to go unsold and in the worst case has hurt their brand image and relationships in the programmatic ecosystem, as well as led to erratic clawbacks that make it hard to manage their business P&L’s.
The KAI Dashboard provides granular optimization reporting, including 38 categories of fraud (both GIVT and SIVT) and technical RTB issues, such as missing user agent information, mismatched app store information, and missing bidding information. Coupled with the KAI Enterprise solution, publishers and media platforms can directly control what inventory is sent to the demand side, preemptively blocking RTB opportunities that are likely not to transact or potentially to be flagged as fraud to avoid negative brand impact and clawbacks. At the same time, the KAI Dashboard enables users to take action to mitigate the issues and increase the yield and monetization rate for their inventory.
“After spending over two decades in the digital advertising space on both the advertiser and publisher side, I can relate to the challenges that those companies are facing,” says Paul Roberts, CEO and founder of Kubient, “The KAI Dashboard and KAI Enterprise significantly solve those challenges by giving further insight into parts of programmatic where there was none, and helps give publishers and platforms the tools to make inventory consumable, and monetizable with the demand side. It’s a business intelligence tool with actionability offering transparency in real time where there was none.”
The dashboard has already helped publishers tremendously by showing full insights into inventory health, driving improvements in inventory quality and increasing ad monetization efforts for greater revenue acquisition.
On average, premium CTV publishers implementing the KAI Enterprise solution or that have joined the Kubient Marketplace with KAI built in have identified approximately 20% of their inventory on average that is not being monetized. Through the new dashboard insights, these publishers are able to identify what is causing their inventory to not be monetized and allows them to take immediate action and drive increased revenue.
The KAI dashboard incorporates 3 reports and 1 Discovery Tool. Each of the three reports is broken down by a dimension. Below are a few details about the dashboards:
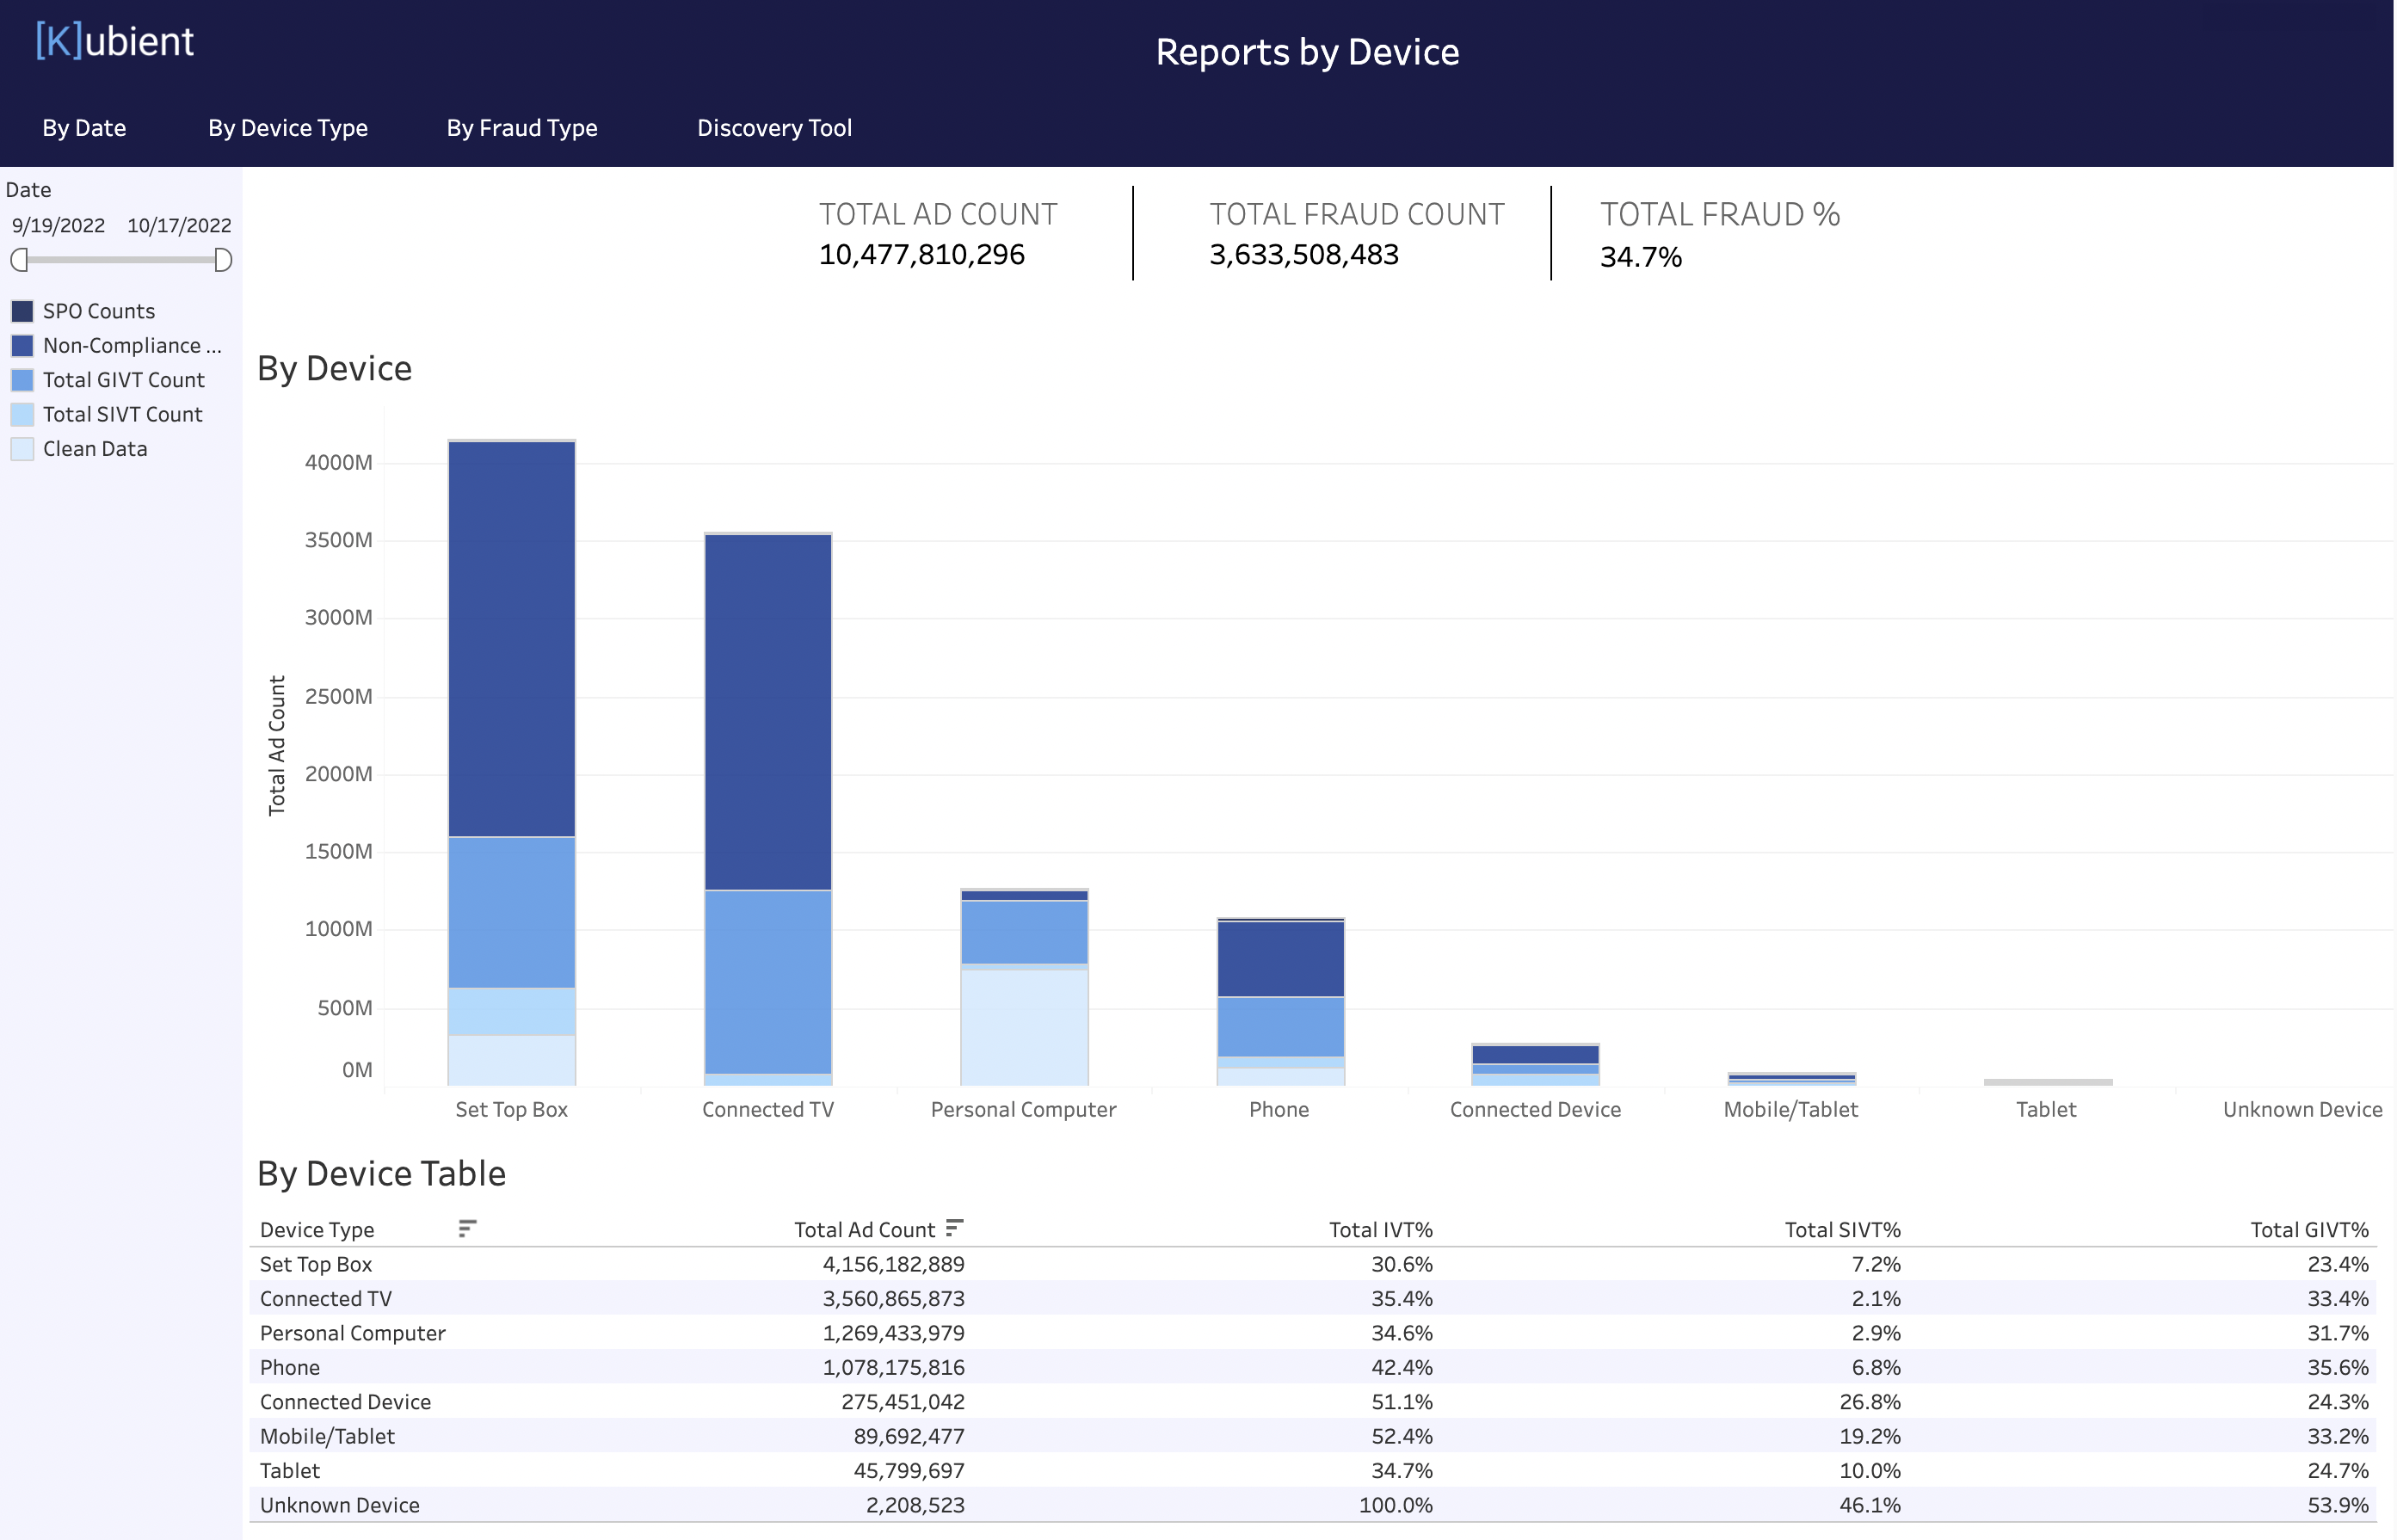
- By Device Type: Here the fraud is categorized into different devices so that the end user can learn about the devices that have the most amount of fraud. In our data we see Mobile and Connected Devices having almost 50% fraud. In the dashboard, we can see the total IVT (Invalid Traffic) % and also the SIVT (Sophisticated Invalid Traffic)
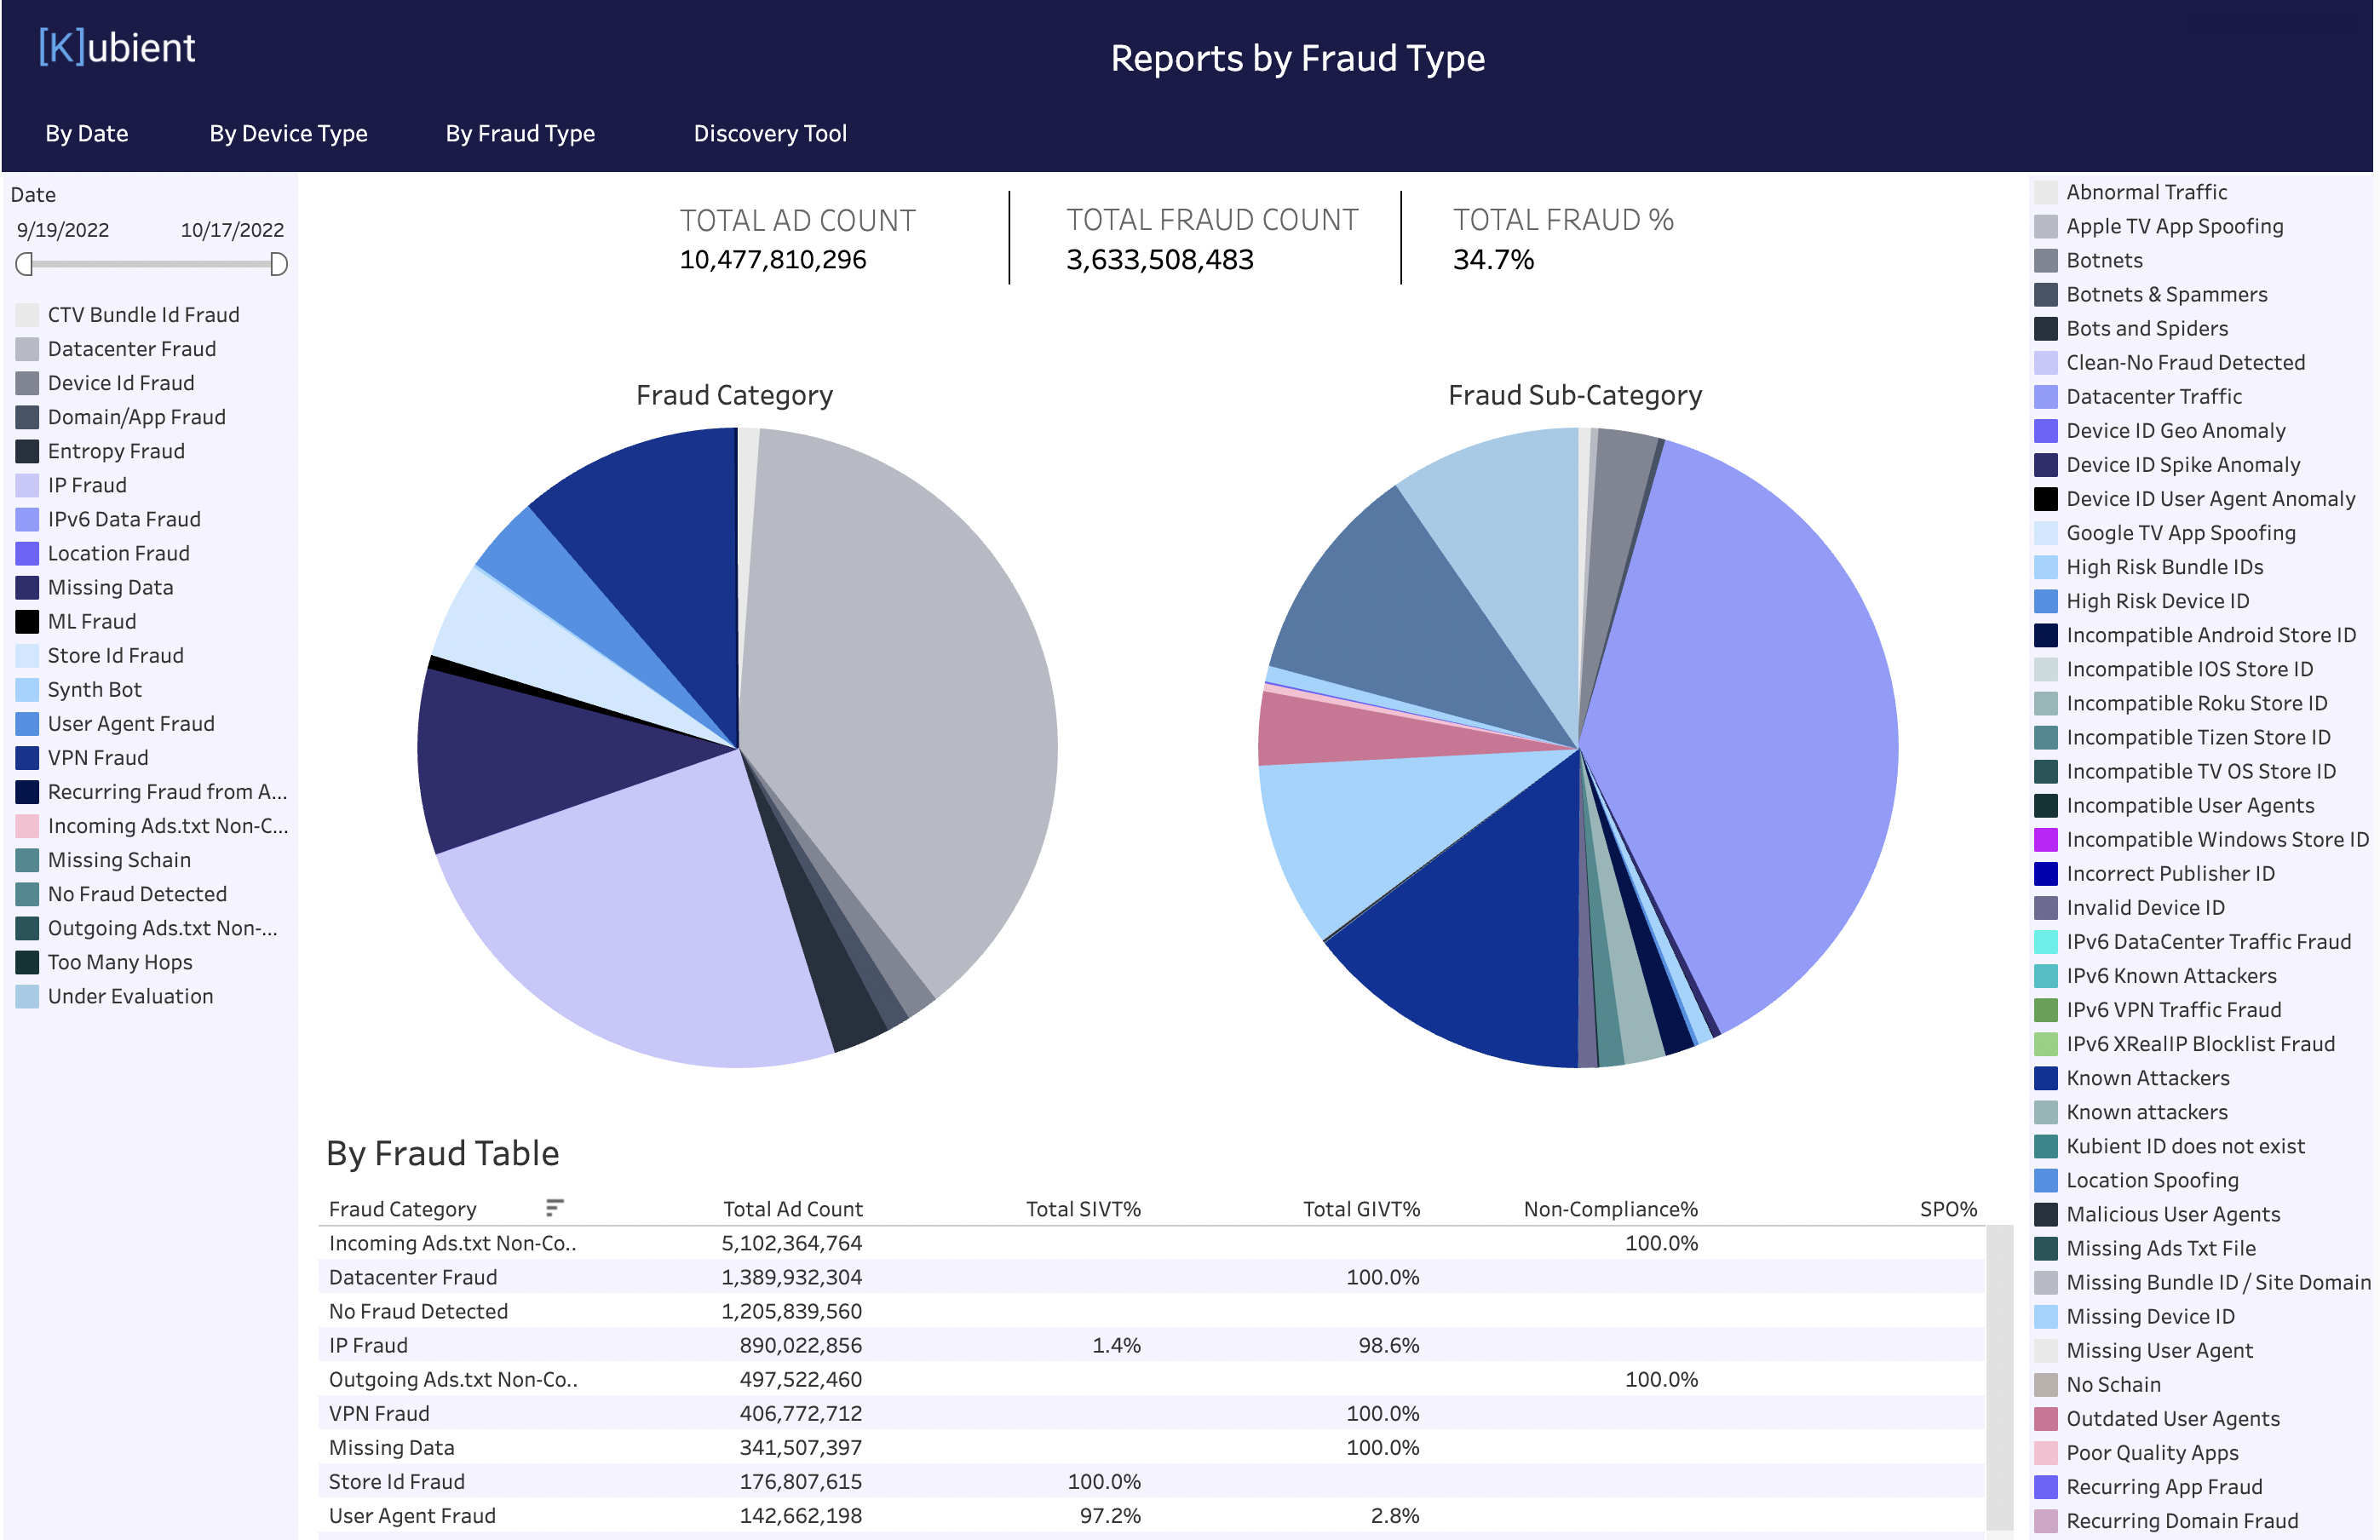
- By Fraud Type: Here we can see a detailed breakdown of the different fraud types we see in our traffic. We have over 38 types of fraud categories and the end user can learn about the fraud types that are most common in their traffic. This helps them take necessary actions working alongside the publishers and helping them get their fraud rates in control
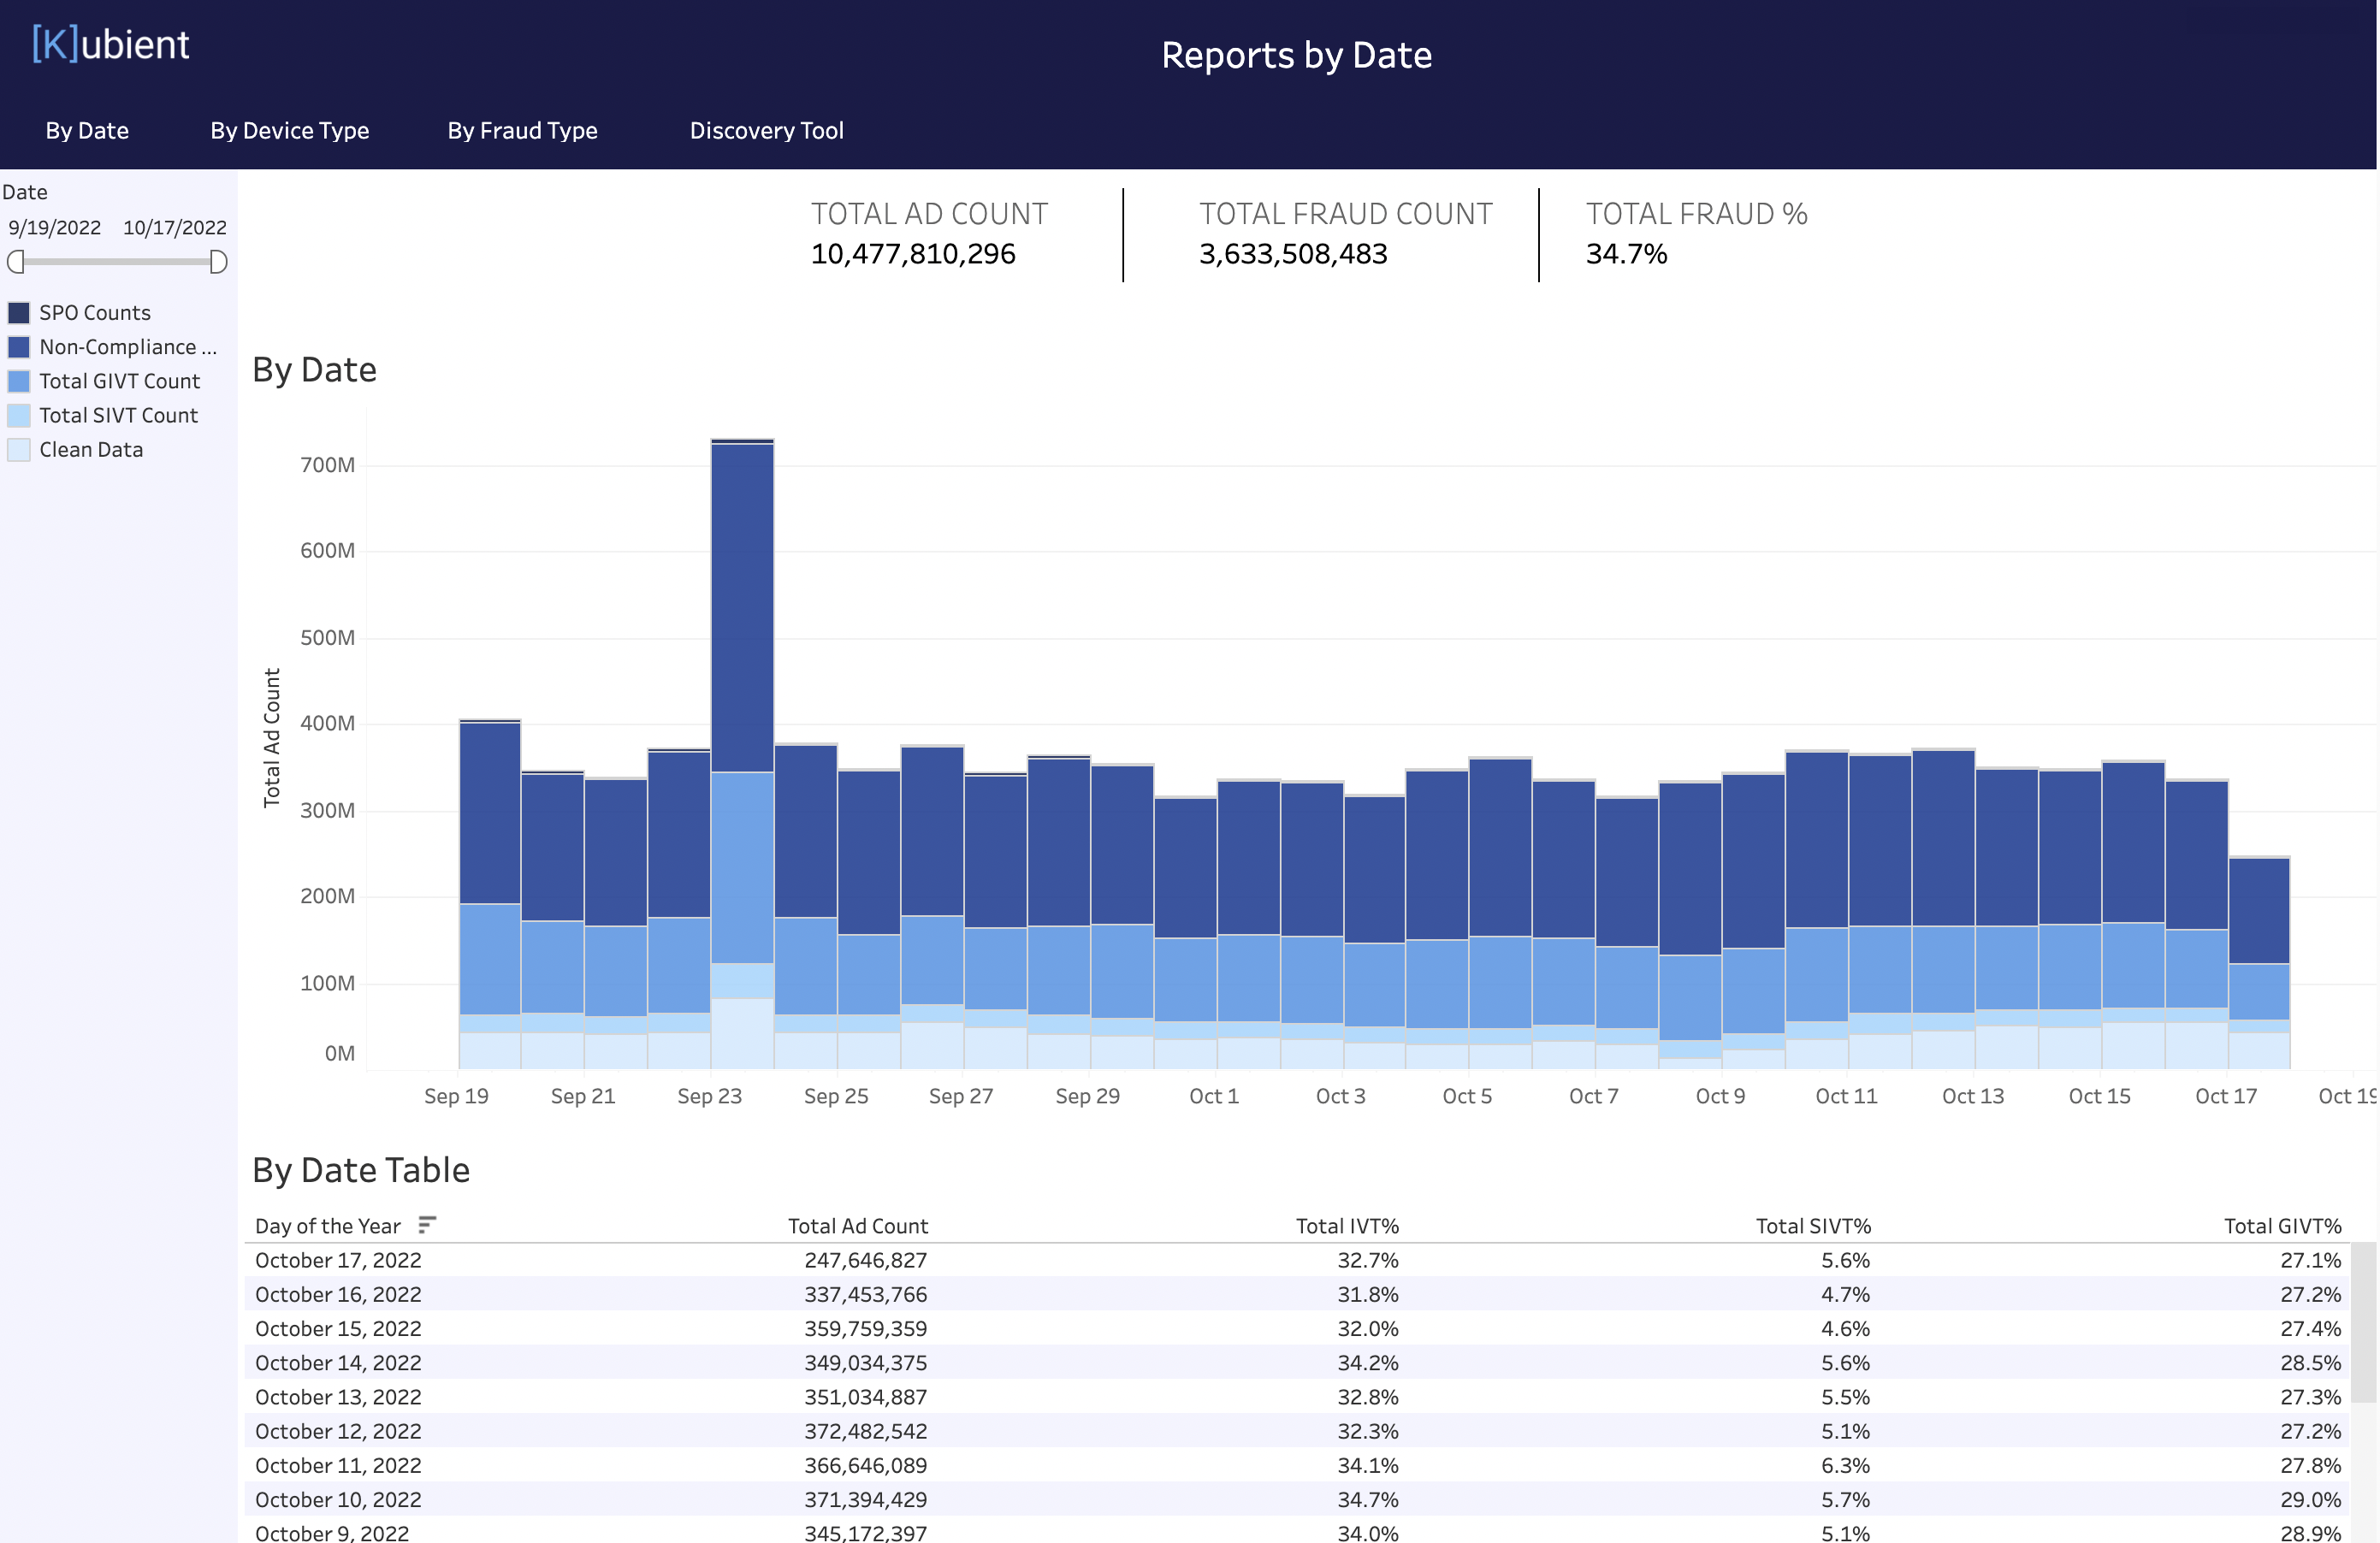
- By Date: Here we can observe the overall fraud trend and see the graph of the fraud across different time periods
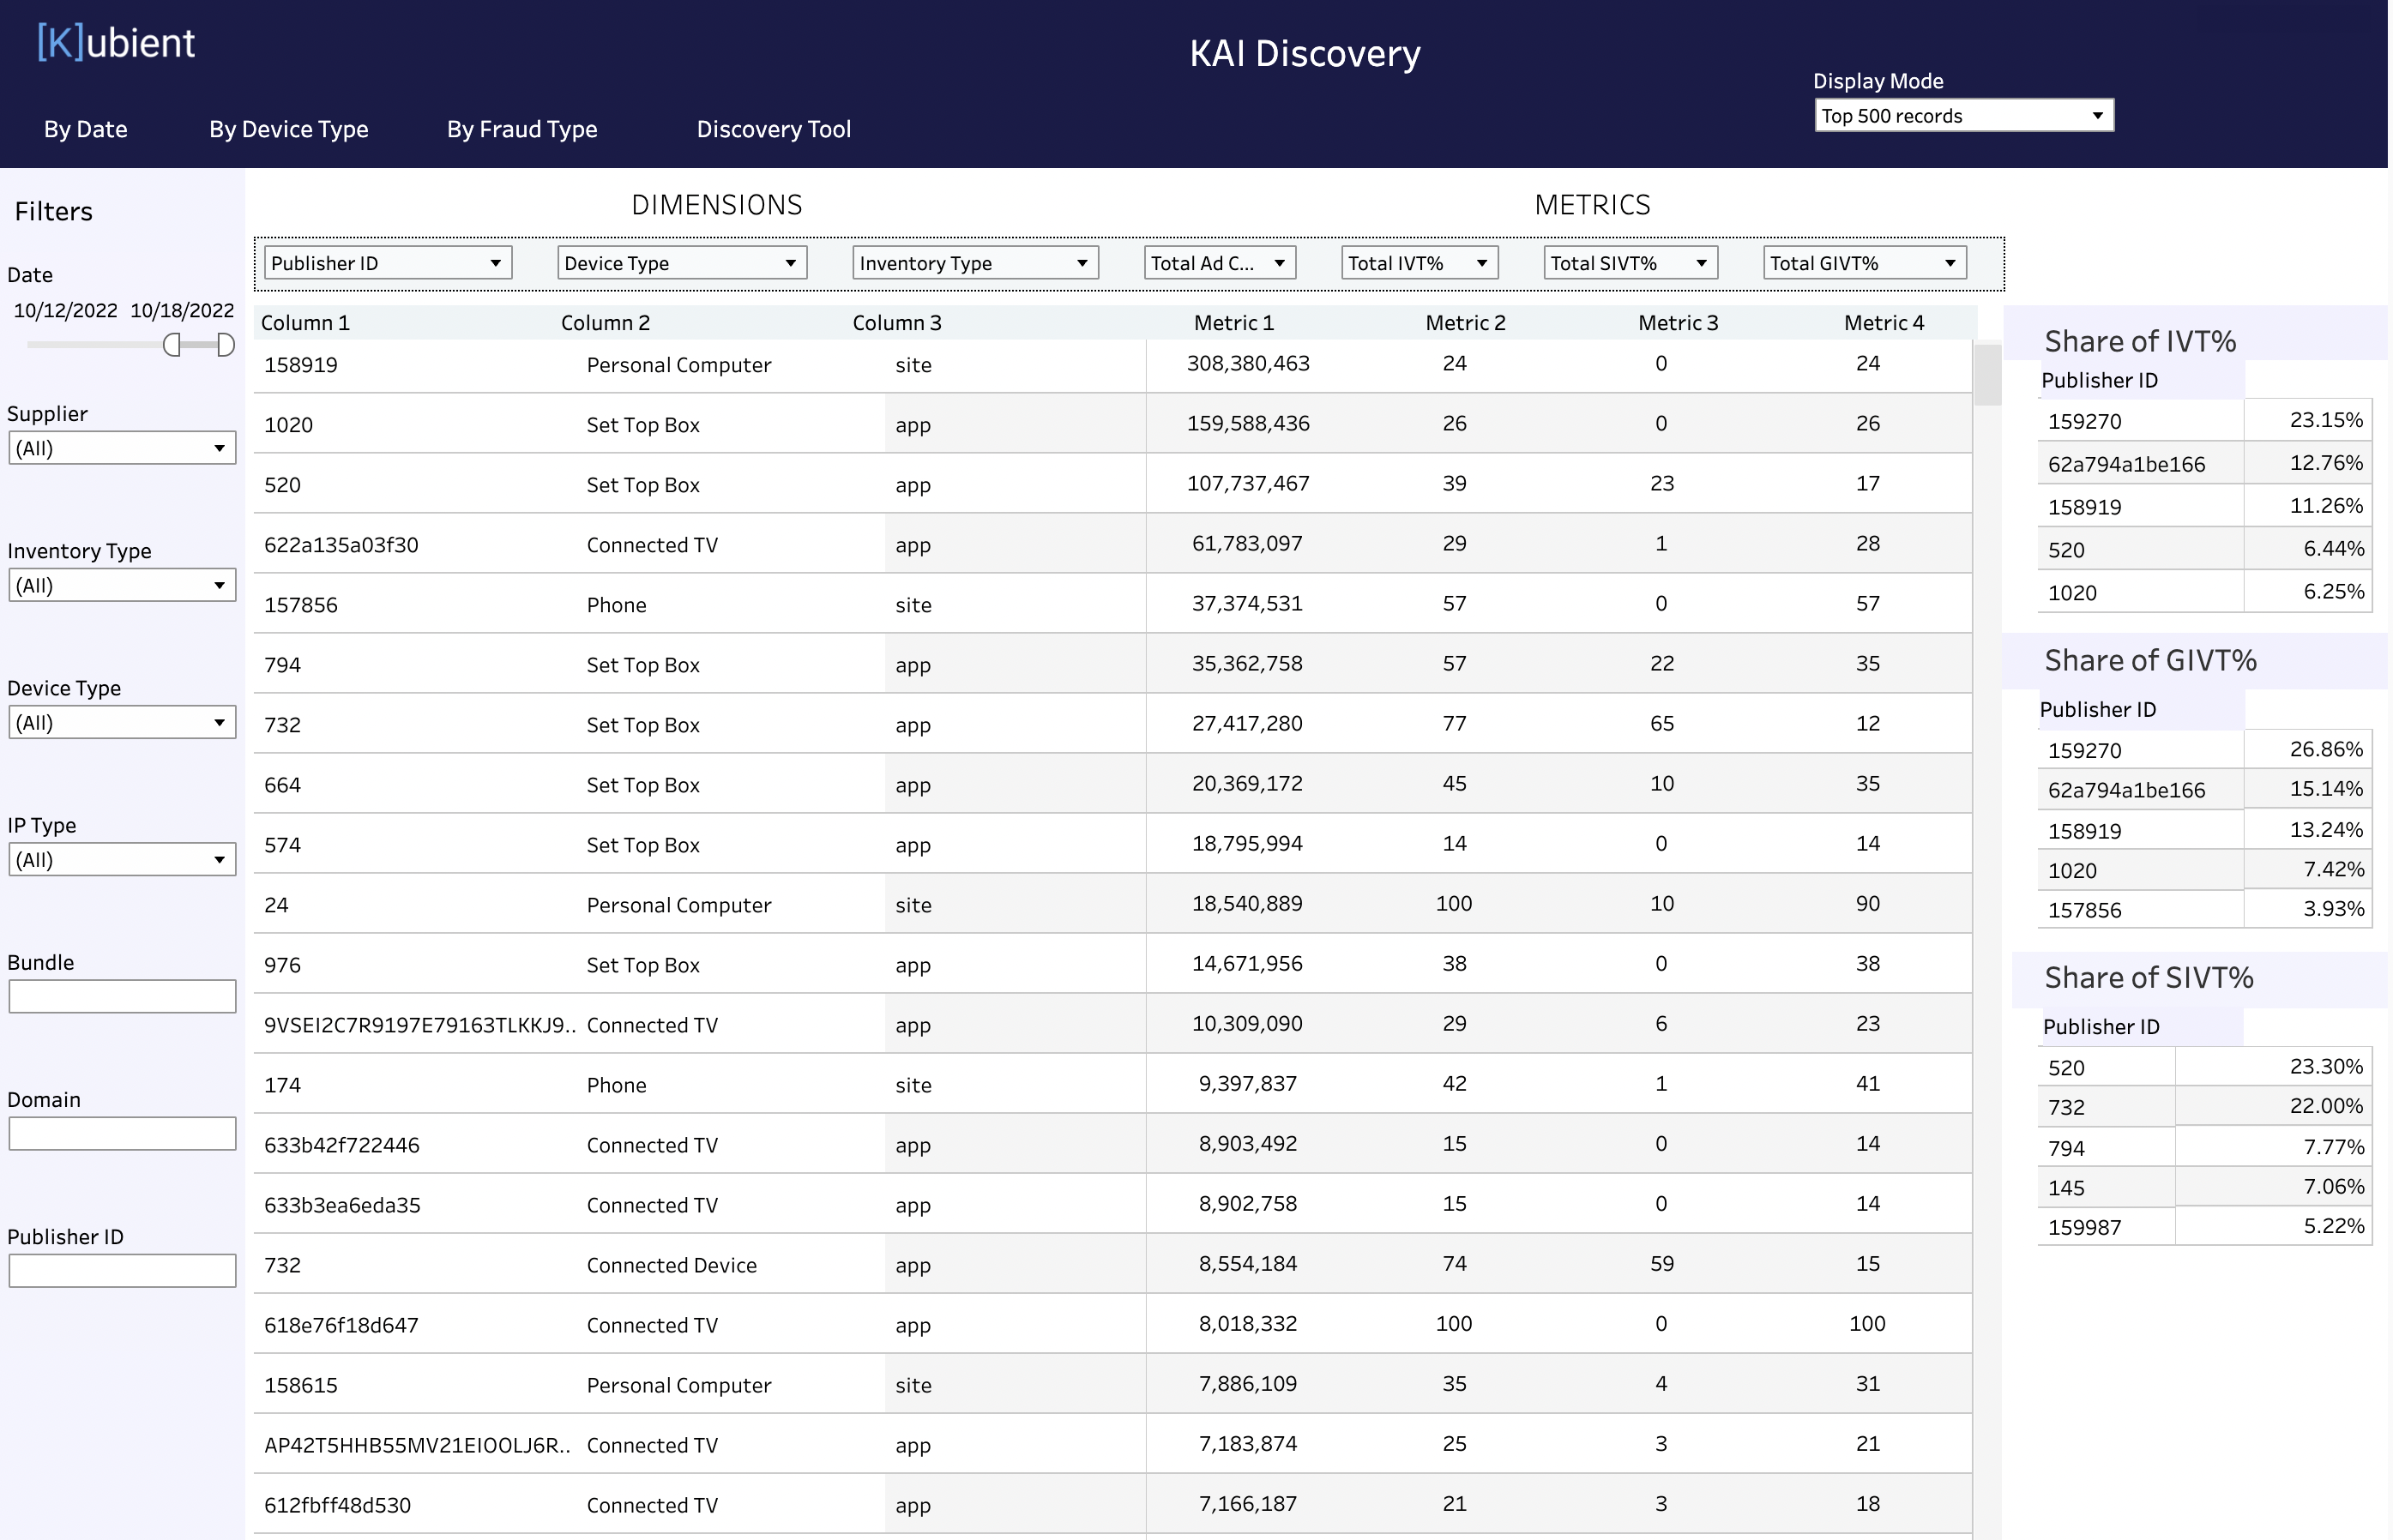
- Discovery Tool: This is the most interactive part of the tool where the end user can choose a combination of up to 3 dimensions and 4 metrics from a list of 9 dimensions and 11 metrics to populate the graphs and get the fraud details based on their use case. They can see fraud breakdowns at the App/Domain, Publisher, and Supplier levels. They can also segregate their traffic by IP type to see how much of their traffic and fraud comes from IPv4 vs IPv6
Each of these reports has different filters that help the end user narrow down the traffic and analyze the most important data for their use case.
Recently, Kubient received notice of allowance for patent-pending solution KAI. To learn more about Kubient and KAI, please visit, https://kubient.com/kai/.